Case Studies
California's Central Valley: the first case study
Second Growth's first body of research documents more than fifty years of commodity agriculture consolidation in California's Central Valley, and what it has meant for the people who did the work of growing and processing it. We're starting with four counties — Kings, Fresno, Tulare, and Stanislaus — where that pattern is long-running and well documented.
Start here: the whole picture, one map
This research actually runs on two different geographies — county lines for the economic data, groundwater subbasins for the water data, because water doesn't follow county lines. Switch between them below before reading the section-by-section detail that follows.
Food manufacturing dependence, by county
Employment SDI vs. the U.S. benchmark, 2025
Click a county or subbasin for its full detail, or a marker for what happened at that specific location.
View as table (both geographies)
| Geography | Area | SDI (2025) | Unemployment (Aug 2026) | Groundwater depth (2026) | Change since 2015 |
|---|---|---|---|---|---|
| County | Kings | 0.153 | 8.5% | — | — |
| County | Fresno | 0.100 | 7.8% | — | — |
| County | Tulare | 0.119 | 10.4% | — | — |
| County | Stanislaus | 0.205 | 7.0% | — | — |
| Subbasin | Kings Subbasin | — | — | 131.4 ft | −11.2 ft |
| Subbasin | Tulare Lake Subbasin | — | — | 173.2 ft | −2.6 ft |
Counties and subbasins are genuinely different geographies, not a single table pivoted two ways — see the "—" cells above. Kings County alone spans both the Kings and Tulare Lake groundwater subbasins.
County and state boundaries: U.S. Census Bureau via us-atlas. Terrain: Natural Earth 1:50m Gray Earth. SDI: Second Growth calculation, see Methodology.
The pattern we're tracking
Commodity food processing has been a defining industry across these counties for generations — the kind of industry a region's labor market, tax base, and civic life organize around. Over the past two years alone, plant closures and mass layoffs tied to major processors have removed well over two thousand documented jobs across Stanislaus, Kings, and Fresno counties, and that period sits inside a far longer pattern of consolidation that goes back decades. Reporting around one recent closure placed it among roughly sixty Central Valley plant closures or mass layoffs in a single year.
These aren't isolated business decisions happening in a vacuum. They track a structural pressure on the region: California's Sustainable Groundwater Management Act is expected to push a significant share of San Joaquin Valley irrigated farmland out of production over the next two decades as groundwater use is brought into balance. Processing capacity and the water-constrained supply it depends on are moving in the same direction, in the same places, at the same time.
The long arc, in one timeline
"Fifty years" and "sixty closures in a single year" are two very different kinds of claim — one about a slow multi-generational pattern, one about a sudden acceleration. Both are true, and the gap between them is itself worth seeing: the first eight events below are spread across more than a century; the last five happened within about two years. The zoomed-in panel isn't a different chart — it's the same spine, broken and magnified so the recent cluster doesn't collapse into a single dot.
Central Valley/Sacramento commodity-ag processing, 1912–2026
Founding and ownership milestones, bankruptcy filings and policy, and plant closures — sourced to original reporting, company filings, and public records. See Data for full citations, including the two events flagged below as thinly sourced.
Click or tap any point on the timeline above for its full description and sourcing.
View as table, with sourcing notes
| Year | Event | Sourcing |
|---|---|---|
| 1912 | Libby, McNeill & Libby cannery built, Sacramento | Well documented |
| 1931 | Bercut-Richards cannery founded, Sacramento | Well documented |
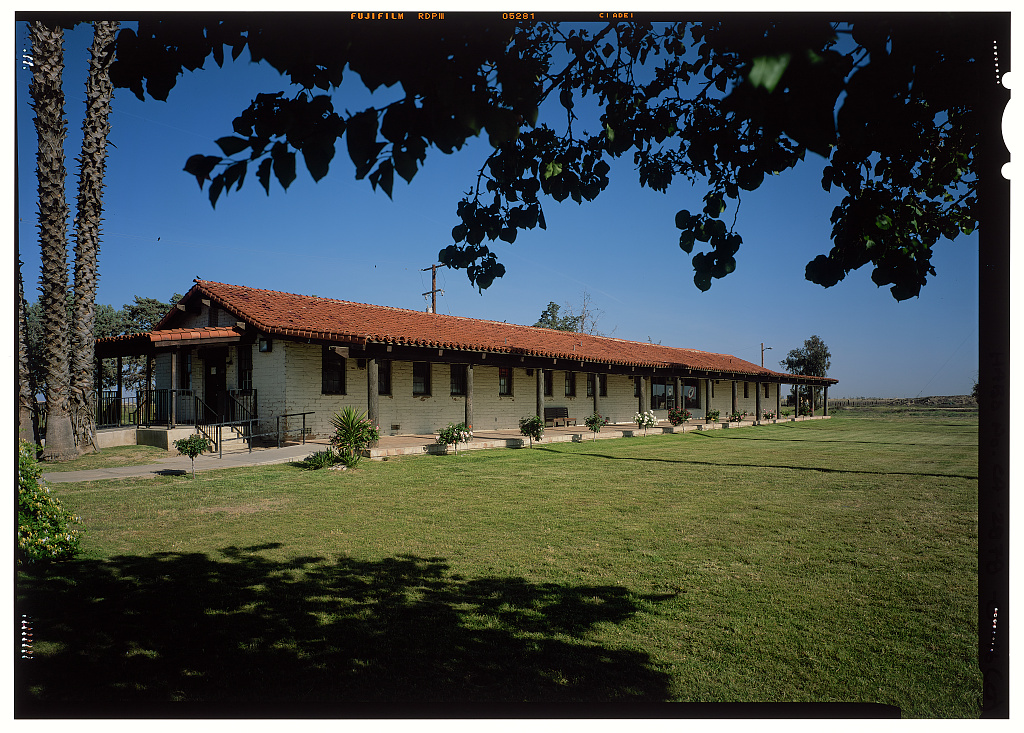
| 1966–67 | Forty Acres becomes UFW headquarters; Farm Worker Cooperative founded, Delano | NPS National Historic Landmark nomination (2008) |
| ~1982 | Libby cannery closes, Sacramento | Thin. No contemporaneous news source located; exact year unconfirmed (early-1980s range, building NRHP-listed March 1982) |
| 1993 | Bercut-Richards cannery closes, Sacramento | Thin. No contemporaneous 1993 news source located; drawn from retrospective secondary sources |
| 2000 | Tri Valley Growers files Chapter 11; ~11,000 Central Valley jobs lost | UC Davis Giannini Foundation (2004), Journal of Cooperatives (2009), cross-verified job figure |
| 2012–13 | Campbell Soup closes Sacramento plant; 700 jobs | Company press release plus three independent local-news outlets |
| 2014 | California's Sustainable Groundwater Management Act (SGMA) signed into law | Public legislative record |
| 2024 | Olam/OFI closes Firebaugh plant; 275 jobs | WARN filing plus local/trade-press reporting |
| 2024 | Olam/OFI closes Lemoore tomato plant | Disputed. Reported job counts range from 250 to 567 across sources; not yet resolved with an independent primary source |
| 2025 | Del Monte Foods files Chapter 11 | Company bankruptcy filing, July 2025 |
| 2026 | Del Monte closes Hanford tomato plant, Kings County; 378–500+ jobs | WARN filing plus local/trade-press reporting |
| 2026 | Del Monte closes Modesto/Hughson canneries, Stanislaus County; 765 jobs | Multiple independent news outlets, federal aid records |
* Flagged in our sourcing notes as thinly documented — see Data for the full access-limitations writeup (pre-1995 regional newspaper archives are not freely web-indexed, which is the single biggest limiting factor for the two earliest closures above).
Sources: UC Davis Giannini Foundation of Agricultural Economics; company press releases and SEC filings; WARN Act filings; Modesto Focus, KTLA, ABC30, San Joaquin Valley Sun, and other local/trade reporting; National Park Service NHL nomination records. See Data for the full citation list.
Groundwater: a different geography
Hanford and Corcoran are both Kings County — but they sit in two different groundwater subbasins, which follow hydrology, not county lines. A water map of this region has to use its own geography, not the county map above.
Depth to groundwater, by subbasin
Most recent reading, averaged across all wells with data since 2023
Where this sits in California
View as table
| Subbasin | Current depth to groundwater | Wells | Change since 2015 | Paired wells |
|---|---|---|---|---|
| Kings Subbasin (Hanford) | 131.0 ft | 229 | −11.2 ft (shallower) | 71 |
| Tulare Lake Subbasin (Corcoran) | 176.6 ft | 73 | −2.6 ft (shallower) | 23 |
Subbasin boundaries: DWR Bulletin 118, via CA GIS open-data portal. County lines shown for reference: U.S. Census Bureau via us-atlas. Terrain: Natural Earth 1:50m Gray Earth. Groundwater: DWR periodic groundwater level measurements. See Data.
The long arc, scrub the slider to see it: both subbasins have gotten dramatically deeper since 1950 — Kings Subbasin from 38 ft to 131 ft (roughly 3.4x), Tulare Lake Subbasin from 38 ft to 173 ft (roughly 4.6x) — a real, 76-year decline consistent with the broader SGMA story this section opened with.
An honest complication, not smoothed over: the "Change since 2015" layer (a careful, same-well paired comparison) shows both subbasins getting shallower in just the last decade, not deeper — and a simpler year-to-year average comparison using the slider above disagrees with that paired method about Kings Subbasin's recent direction entirely. The two methods use different, non-identical sets of wells (the monitoring network itself has shrunk over time — Kings Subbasin alone went from 544 reporting wells in 1950 to 193 in 2026), and we don't have a confident answer for which is closer to the truth. We'd rather show you the disagreement than quietly pick the number that fits the narrative. Full method and the real numbers behind both claims: Data.
Kings County: the flagship case study
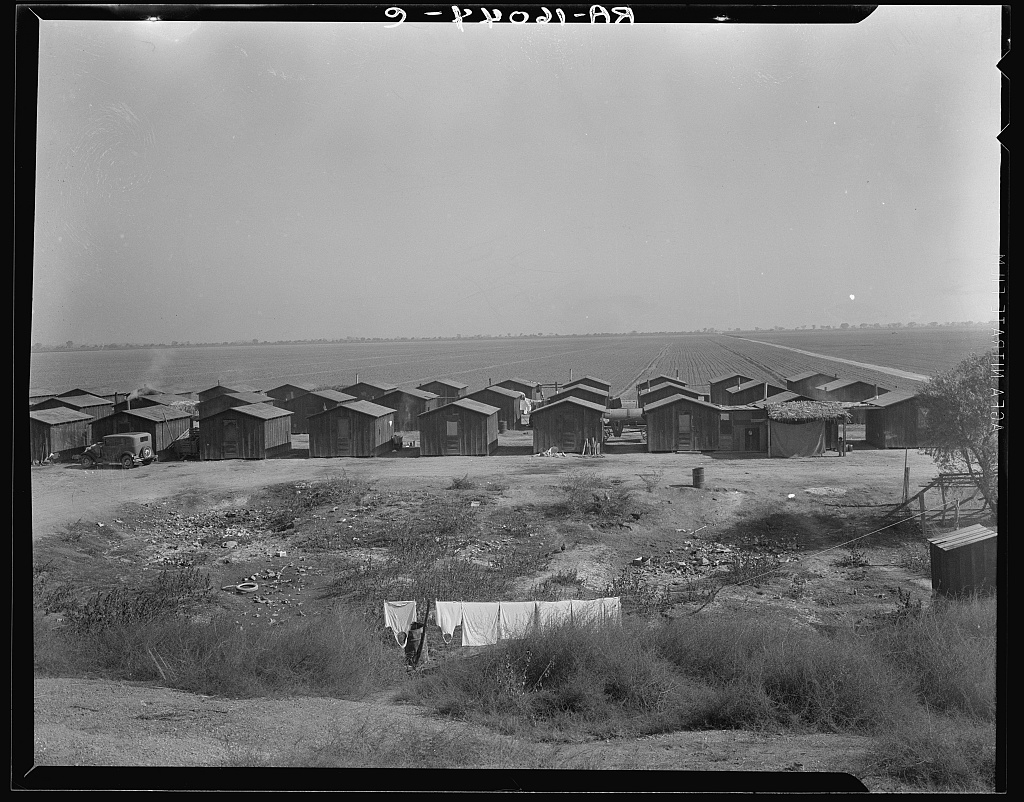
In March 2026, Del Monte closed its Hanford tomato-processing plant — the only tomato-processing facility in the company's entire ten-plant U.S./Mexico roster — eliminating 378 to 500-plus jobs.
Food manufacturing wasn't a marginal part of Kings County's economy when that plant closed. By our Sector Dependence Index, the sector's share of the county's entire export-driven economic base more than doubled between 1990 and 2025 (Employment SDI: 0.070 → 0.153 against the U.S. benchmark) — meaning the closure landed on a growing, increasingly central pillar of the county's economy, not a shrinking, marginal one. That's a measurable claim, not an impression — see the Index for the full numbers and Methodology for how we calculated them.
Stanislaus County: the larger, older closure
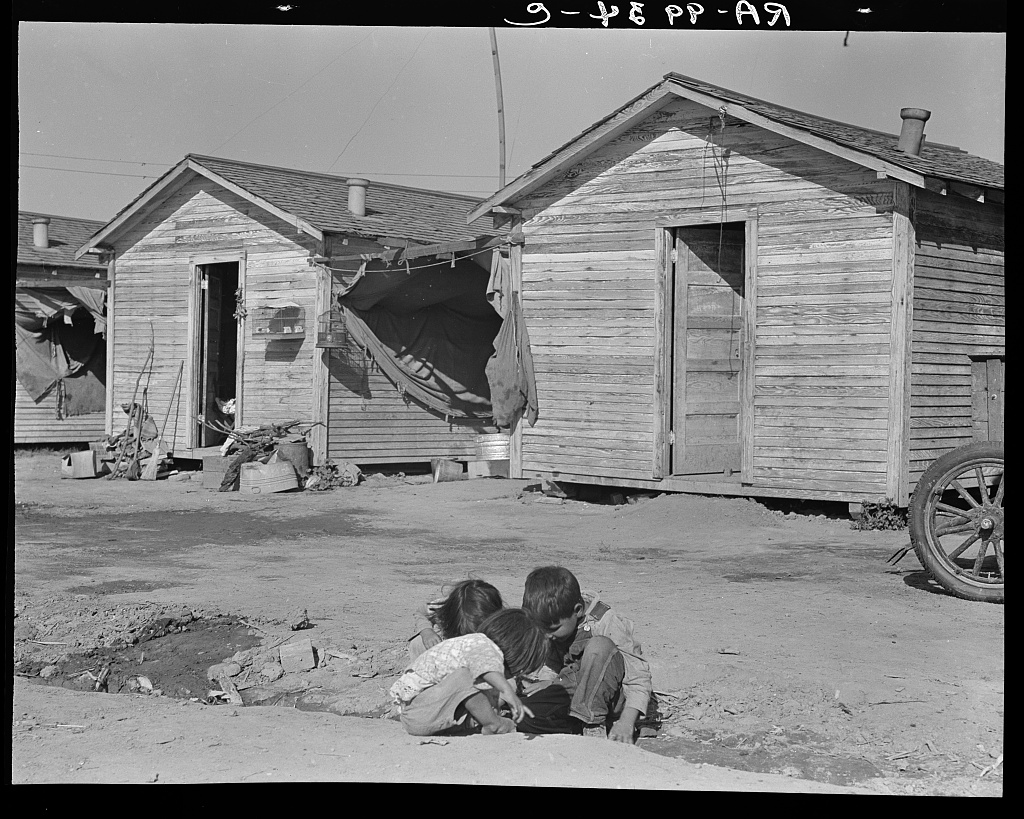
Del Monte's Modesto/Hughson canneries closed in April 2026, eliminating 765 permanent jobs and ending 20-year supply contracts with roughly 70 California peach growers — a closure substantial enough that growers are now removing an estimated 420,000 clingstone peach trees. Stanislaus has the highest food-processing dependence of the four counties we track (Employment SDI 0.205 in 2025), but — unlike Kings — that dependence has been declining since 1990 (from 0.277), not rising. We haven't yet explained why these two flagship closures sit on opposite economic trajectories; it's a real open question for further research, not glossed over here.
Fresno and Tulare Counties
Both counties carry real, continuing exposure to the same sector — Olam/OFI's Firebaugh closure (275 jobs, 2024) sits in western Fresno County, and the broader closure wave has touched Tulare as well — but at this stage their Sector Dependence Index figures (Fresno: 0.100; Tulare: 0.119, 2025) are lower than Kings' or Stanislaus', and the narrative case-study work for each is still being built out. We're publishing their numbers now rather than waiting for the full narrative, consistent with our commitment to a checkable record over a polished one.
What we're documenting
- The closures themselves — company, location, job counts, and timing, sourced to original reporting and public filings wherever we can get a primary source rather than a secondhand account.
- The longer arc — how this round of closures fits into a pattern of commodity-processing consolidation that has been displacing Central Valley farmworkers for more than fifty years, not a single recent shock.
- The structural drivers — the groundwater and land-use pressures that are reshaping what can be grown, and processed, in the affected counties going forward.
- Precedent — real examples, in this region's own history and elsewhere, of worker- and community-ownership structures that changed who held the cost when an industry contracted.
An honest limitation
This research documents industry exit and its effect on displaced labor. It does not, by itself, resolve separate infrastructure problems — like drinking-water contamination in some unincorporated Central Valley communities — that sit on the same groundwater basins but require their own distinct remedies. We try to be precise about what our research does and doesn't address, rather than overstating its reach.